I am using Percona 10.1.9 for magento2. I am getting strange issue on this DB server, it using all core 100 % suddenly and after few minutes it will down to 60% then again going 100%.
due to that the website not working fine and we are unable to business.
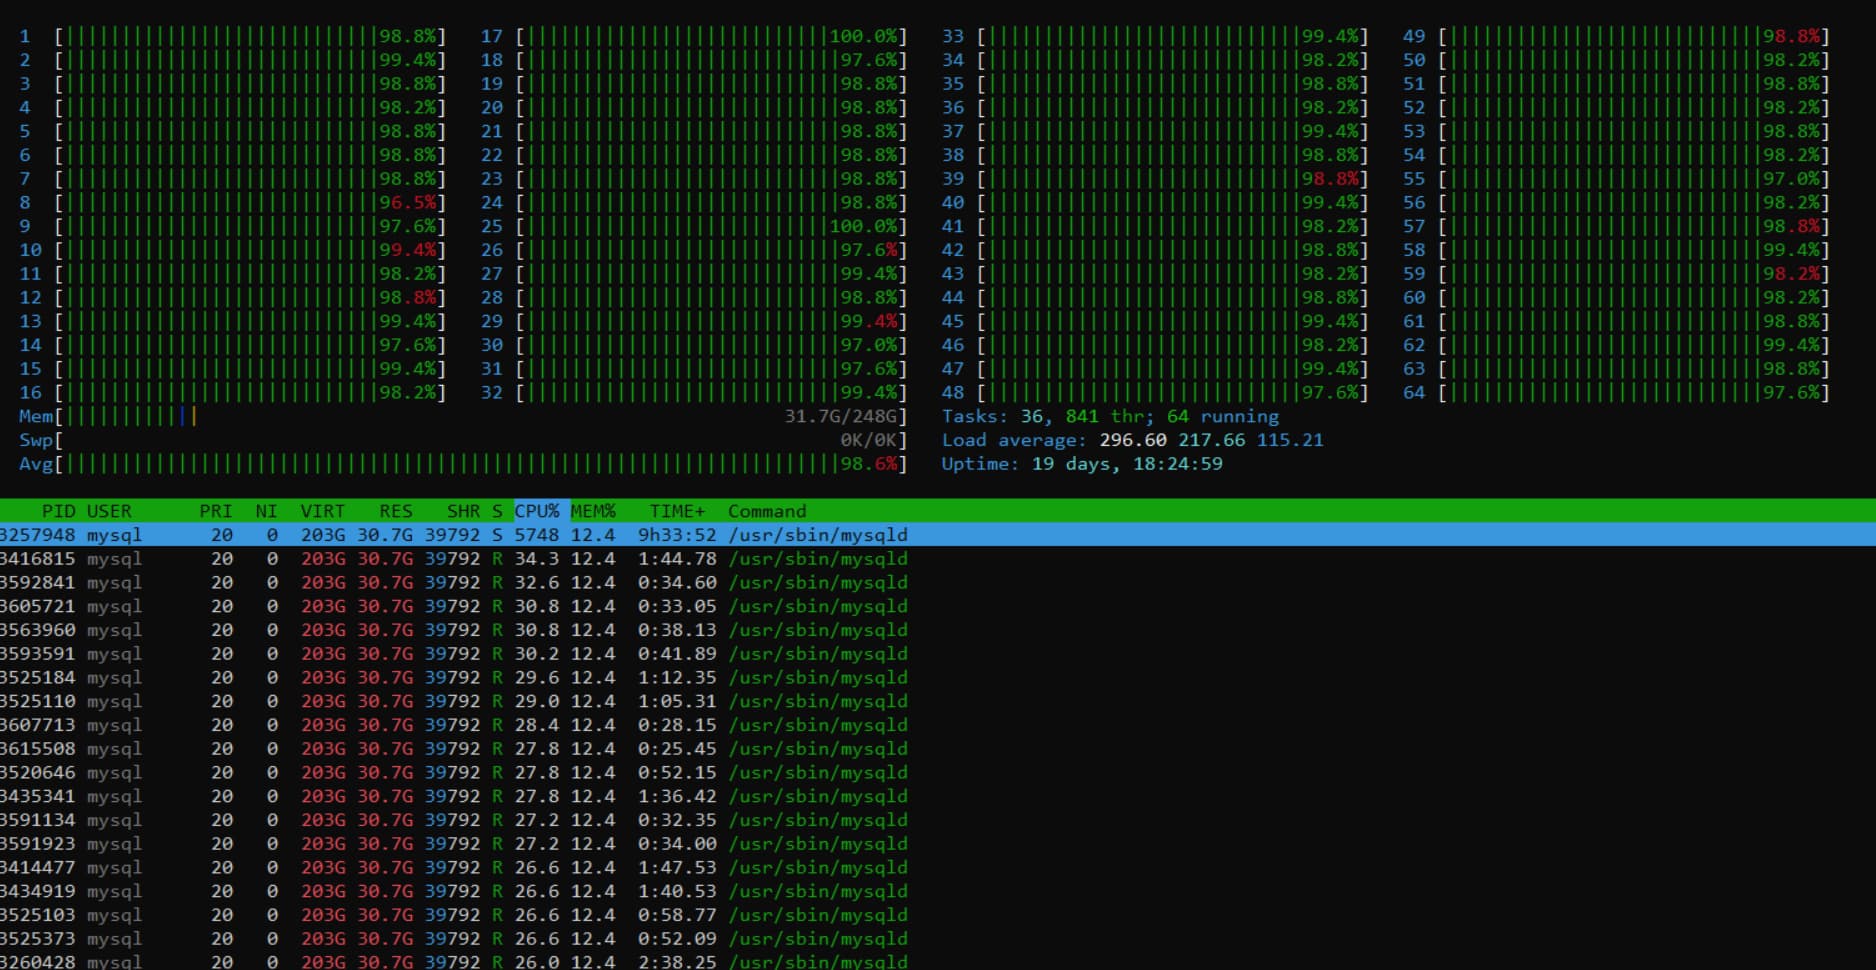
When I check on database server using htop command MySQL virtual memory is around 180 to 190 G. I also try to restart MySQL but after restart few seconds this virtual memory again around 180 G.
now it showing it using 203G.
@hemendra, you can install PMM - Percona Monitoring and Management - Database Monitoring [NEW] - Percona to monitor server activity and executed DB queries.
p.s. version “10.1.9” is strange, as it sounds like the MariaDB version, not Percona. But PMM should work with it too.

please check this it not showing mariaDB
You may have had recent changes to your Magento 2 code, perhaps some new Plugins or Modules have been installed, which has affected database queries and performance degradation.
How does OpenSearch/Elasticsearch feel?
it working fine.
we reverted/ disabled that code on server but still getting issue and we are not getting from where it going .
Hi @hemendra welcome to Percona Community.
I see you mentioned Percona 10.1.9 which led Roma to believe you’re on MariaDB. I now see that you confused the version with IP 10.1.9.204.
Now, I see you’re talking about the spiking load on the database causing high CPU and application being unresponsive. As suggested, installing PMM will allow you to observe what’s going on in there and thus identify what’s causing the spikes.
Consider reviewing your connections, processlist queries. Without that it is not that straight forward to answer a question.
Thanks,
K.
I can assume that Magento has a server configuration that specifies 10.1 as the version parameter for MySQL, but the MySQL itself is Percona Server. 
After revert recent changes, still it showing as
i also check when i disable magento that time usages as
no idea why it having this, can any one help on this.
Hi @hemendra,
can any one help on this.
What we know is, you see CPU spikes upon enabling your app and all is OK when you disable it.
BUT what happens when you enable your app? What queries, connections, configuration is in effect, what’s using the CPU? Is it MySQL, is it Magento? Could you see what was going on inside MySQL while you see the spike? If you don’t see it, you won’t fix it
And hence, consider setting up PMM OR have your own methods to find what’s causing the issues. May be if you can provide us with the following, we might be able to pinpoint something:
$] wget percona.com/get/pt-summary && chmod +x pt-summary && ./pt-summary
(Assuming you have creds in .my.cnf run this)
$] wget percona.com/get/pt-mysql-summary && chmod +x pt-mysql-summary && ./pt-mysql-summary
(and / or Manually execute following commands in MySQL)
mysql> show processlist;
mysql> show engine innodb status\G
mysql> show global status;
mysql> show global variables;
Thanks,
K