Hi Team,
Can someone help me, where can i check the Database Throughputs Graph like MonYog?
Hi @Naresh9999 , thank you for posting to the Percona Forums!
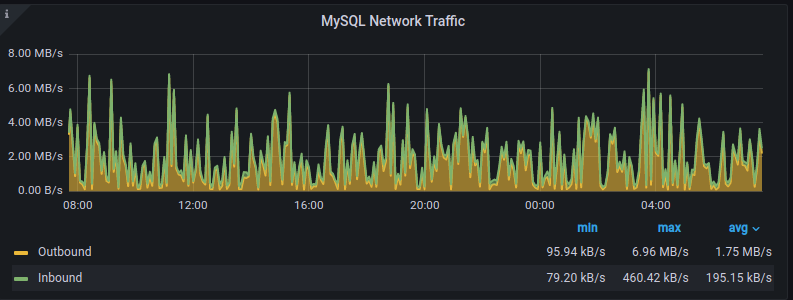
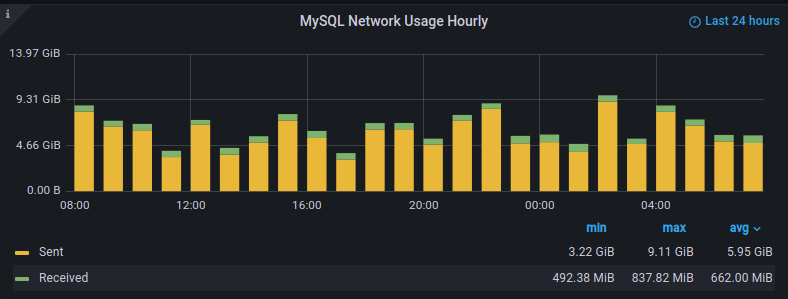
You’ll find there are a couple of similar views in PMM. If you navigate to the dashboard MySQL Instance Summary you’ll see a MySQL Network Traffic and MySQL Network Usage Hourly graphs which will help you understand your database throughput:
Thanks for the quick help. But which is not cleared about the heading, what we are looking for it. Can it be a named to Database Throughputs something like that?
Hi @Naresh9999
PMM uses different names than Monyog, and I don’t believe that Percona is making any effort to align graphs in PMM with Monyog either.
If you would like to re-name the dashboard your option is to make a copy of the existing dashboard and then edit the copy. We have blocked the ability to edit the vanilla dashboards shipped with PMM since they are expected to be overwritten during each version upgrade.
Thanks @Michael_Coburn
We will try copy it and see.
Unanswered | Unsolved | Solved
MySQL, InnoDB, MariaDB and MongoDB are trademarks of their respective owners.
Copyright © 2006 - 2024 Percona LLC. All rights reserved.