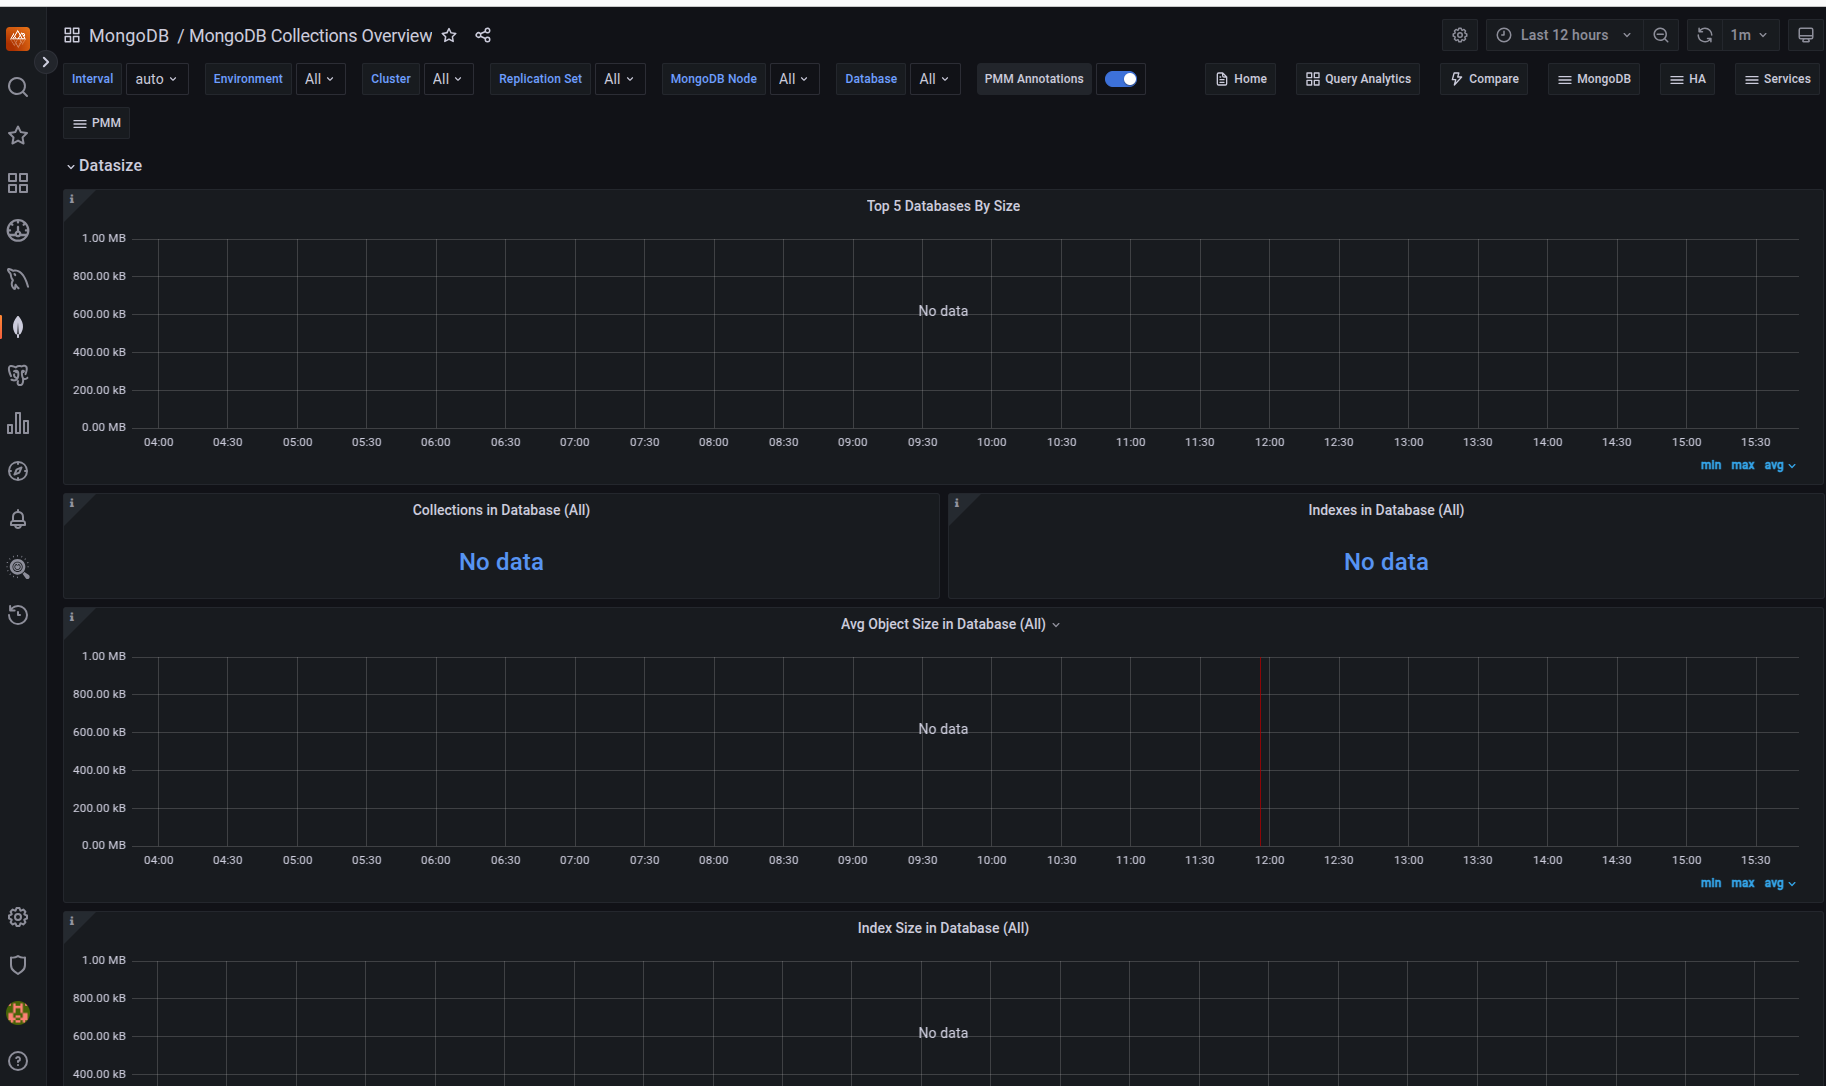
I didn’t have collections showing on my charts either,
I added the --enable-all-collectors flag to pmm-admin add mongodb
And it started to show more data
Example of my Docker Compose with MongoDB Replica Set
version: '3'

services:
  pmm-server:
    image: percona/pmm-server:3
    platform: "linux/amd64" # Specifies that Docker should use the image for the amd64 architecture, which is necessary if the container doesn't support ARM and your host system is ARM (e.g., Mac with Apple Silicon).
    container_name: pmm-server
    ports:
      - 8080:80
      - 443:8443
    healthcheck: # Defines a command to check the container's health and sets the timing for executions and retries.
      test: ["CMD-SHELL", "curl -k -f -L https://pmm-server:8443 > /dev/null 2>&1 || exit 1"]
      interval: 30s
      timeout: 10s
      retries: 5

  mongodb-rs101:
    image: percona/percona-server-mongodb:8.0-multi
    container_name: mongodb-rs101
    ports:
      - "27017:27017"
    command: ["mongod", "--port", "27017", "--replSet", "rs", "--keyFile", "/etc/secrets/mongodb-keyfile", "--bind_ip_all", "--profile", "2", "--slowms", "200", "--rateLimit", "100"]
    environment:
      MONGO_INITDB_ROOT_USERNAME: databaseAdmin
      MONGO_INITDB_ROOT_PASSWORD: password
    volumes:
      - mongodb-data-101:/data/db
      - ./secrets:/etc/secrets:ro
    healthcheck:
      test: ["CMD-SHELL", "mongosh --host localhost --port 27017 --username databaseAdmin --password password --authenticationDatabase admin --eval 'rs.status().ok || 1'"]
      interval: 30s
      timeout: 10s
      retries: 5

  mongodb-rs102:
    image: percona/percona-server-mongodb:8.0-multi
    container_name: mongodb-rs102
    ports:
      - "28017:28017"
    command: ["mongod", "--port", "28017", "--replSet", "rs", "--keyFile", "/etc/secrets/mongodb-keyfile", "--bind_ip_all", "--profile", "2", "--slowms", "200", "--rateLimit", "100"]
    environment:
      MONGO_INITDB_ROOT_USERNAME: databaseAdmin
      MONGO_INITDB_ROOT_PASSWORD: password
    volumes:
      - mongodb-data-102:/data/db
      - ./secrets:/etc/secrets:ro
    healthcheck:
      test: ["CMD-SHELL", "mongosh --host localhost --port 28017 --username databaseAdmin --password password --authenticationDatabase admin --eval 'rs.status().ok || 1'"]
      interval: 30s
      timeout: 10s
      retries: 5

  mongodb-rs103:
    image: percona/percona-server-mongodb:8.0-multi
    container_name: mongodb-rs103
    ports:
      - "29017:29017"
    command: ["mongod", "--port", "29017", "--replSet", "rs", "--keyFile", "/etc/secrets/mongodb-keyfile", "--bind_ip_all", "--profile", "2", "--slowms", "200", "--rateLimit", "100"]
    environment:
      MONGO_INITDB_ROOT_USERNAME: databaseAdmin
      MONGO_INITDB_ROOT_PASSWORD: password
    volumes:
      - mongodb-data-103:/data/db
      - ./secrets:/etc/secrets:ro
    healthcheck:
      test: ["CMD-SHELL", "mongosh --host localhost --port 29017 --username databaseAdmin --password password --authenticationDatabase admin --eval 'rs.status().ok || 1'"]
      interval: 30s
      timeout: 10s
      retries: 5

  mongodb-rs-init:
    image: percona/percona-server-mongodb:8.0-multi
    container_name: rs-init
    depends_on:
      - mongodb-rs101
      - mongodb-rs102
      - mongodb-rs103
    entrypoint: [
      "sh", "-c",
      "until mongosh --host mongodb-rs101 --port 27017 --username databaseAdmin --password password --authenticationDatabase admin --eval 'print(\"waited for connection\")'; do sleep 5; done && \
      mongosh --host mongodb-rs101 --port 27017 --username databaseAdmin --password password --authenticationDatabase admin --eval 'config={\"_id\":\"rs\",\"members\":[{\"_id\":0,\"host\":\"mongodb-rs101:27017\"},{\"_id\":1,\"host\":\"mongodb-rs102:28017\"},{\"_id\":2,\"host\":\"mongodb-rs103:29017\"}],\"settings\":{\"keyFile\":\"/etc/secrets/mongodb-keyfile\"}};rs.initiate(config);'"
    ]
    volumes:
      - ./secrets:/etc/secrets:ro

  pmm-client:
    image: percona/pmm-client:3
    container_name: pmm-client
    depends_on:
      pmm-server:
        condition: service_healthy
      mongodb-rs101:
        condition: service_healthy
      mongodb-rs102:
        condition: service_healthy
      mongodb-rs103:
        condition: service_healthy
    environment:
      PMM_AGENT_SERVER_ADDRESS: pmm-server:8443
      PMM_AGENT_SERVER_USERNAME: admin
      PMM_AGENT_SERVER_PASSWORD: admin
      PMM_AGENT_SERVER_INSECURE_TLS: 1
      PMM_AGENT_CONFIG_FILE: config/pmm-agent.yaml
      PMM_AGENT_SETUP: 1
      PMM_AGENT_SETUP_FORCE: 1
      PMM_AGENT_PRERUN_SCRIPT: >
        pmm-admin status --wait=10s &&
        pmm-admin add mongodb --service-name=mongodb-rs101 --enable-all-collectors --username=databaseAdmin --password=password --host=mongodb-rs101 --port=27017 --query-source=profiler &&
        pmm-admin add mongodb --service-name=mongodb-rs102 --enable-all-collectors --username=databaseAdmin --password=password --host=mongodb-rs102 --port=28017 --query-source=profiler &&
        pmm-admin add mongodb --service-name=mongodb-rs103 --enable-all-collectors --username=databaseAdmin --password=password --host=mongodb-rs103 --port=29017 --query-source=profiler

volumes:
  mongodb-data-101:
  mongodb-data-102:
  mongodb-data-103: