Hello
After upgrading my PMM and its pmm2-clients , i could not collect MongoDb infos coreectly. Can you help please what I missed?
P.S. un-updated agents are working fine with 2.11.1 ?

Here is pmm-agent service

here is pmm-admin list
Hello
After upgrading my PMM and its pmm2-clients , i could not collect MongoDb infos coreectly. Can you help please what I missed?
P.S. un-updated agents are working fine with 2.11.1 ?
Here is pmm-agent service
here is pmm-admin list
Hi Ghan,
Could you check version of mongodb exporter?
/usr/local/percona/pmm2/exporters/mongodb_exporter --version
Here you are
mongodb_exporter - MongoDB Prometheus exporter
Version: 0.20.0
Commit: 4f042652395daade2292cbe91b5ae644f5c3a834
Build date: 2020-10-19T08:45:41+0000
Ok. It’s the latest version.
It looks like exporter can’t fetch all data from mongodb instances.
Please perform that next command on the node that has a mongod service with issues. But password string has to be replaced by the next one
![]()
curl -s -u pmm:/agent_id/626e6acb-9046-40fe-b1a5-15b078b5a119 http://localhost:42001/metrics | grep mongodb_version_info
It’s a different node so listened port could be a different too.
Please check which port is used by exporter on this node
ps -auxww | grep mongodb_exporter
Hello
Sorry but I have exactly the same problem ![]() Can we continue?
Can we continue?
pmm-admin 2.9.1:
netstat -alnp | grep LISTEN -w

...

tcp6    0   0 :::42001        :::*          LISTEN   7427/mongodb_export

...

curl -s -u pmm:/agent_id/f2e8e21c-5ca0-4f9f-bd6f-4c92767ffc27 <a href="http://localhost:42001/metrics">http://localhost:42001/metrics</a> | grep mongodb_version

# HELP mongodb_version_info Software version information for mongodb process.

# TYPE mongodb_version_info gauge

mongodb_version_info{mongodb="3.6.21-10.0"} 1

The same server after upgrade to pmm-admin 2.12.0:

netstat -alnp | grep LISTEN -w

....

tcp6    0   0 :::42002        :::*          LISTEN   7025/mongodb_export

...

 curl -s -u pmm:/agent_id/f2e8e21c-5ca0-4f9f-bd6f-4c92767ffc27 <a href="http://localhost:42002/metrics">http://localhost:42002/metrics</a> | grep mongodb_version

# HELP mongodb_version_info The server version

# TYPE mongodb_version_info gauge

mongodb_version_info{mongodb="server version is unavailable"} 1

The same server after downgrade back to 2.9.1:

curl -s -u pmm:/agent_id/f2e8e21c-5ca0-4f9f-bd6f-4c92767ffc27 <a href="http://localhost:42001/metrics">http://localhost:42001/metrics</a> | grep mongodb_version

# HELP mongodb_version_info Software version information for mongodb process.

# TYPE mongodb_version_info gauge

mongodb_version_info{mongodb="3.6.21-10.0"} 1
Hi,
We are working on the issue. The progress can be tracked in the jira ticket
Until the issue has not fixed I may suggest to use the old version of exporter.
Here are commands for integrating exporter from pmm 2.10.0 into pmm 2.12.0
I was testing this issue bug ref: https://jira.percona.com/browse/PMM-7116
My test cases listed in the bug report, following is the comment link.
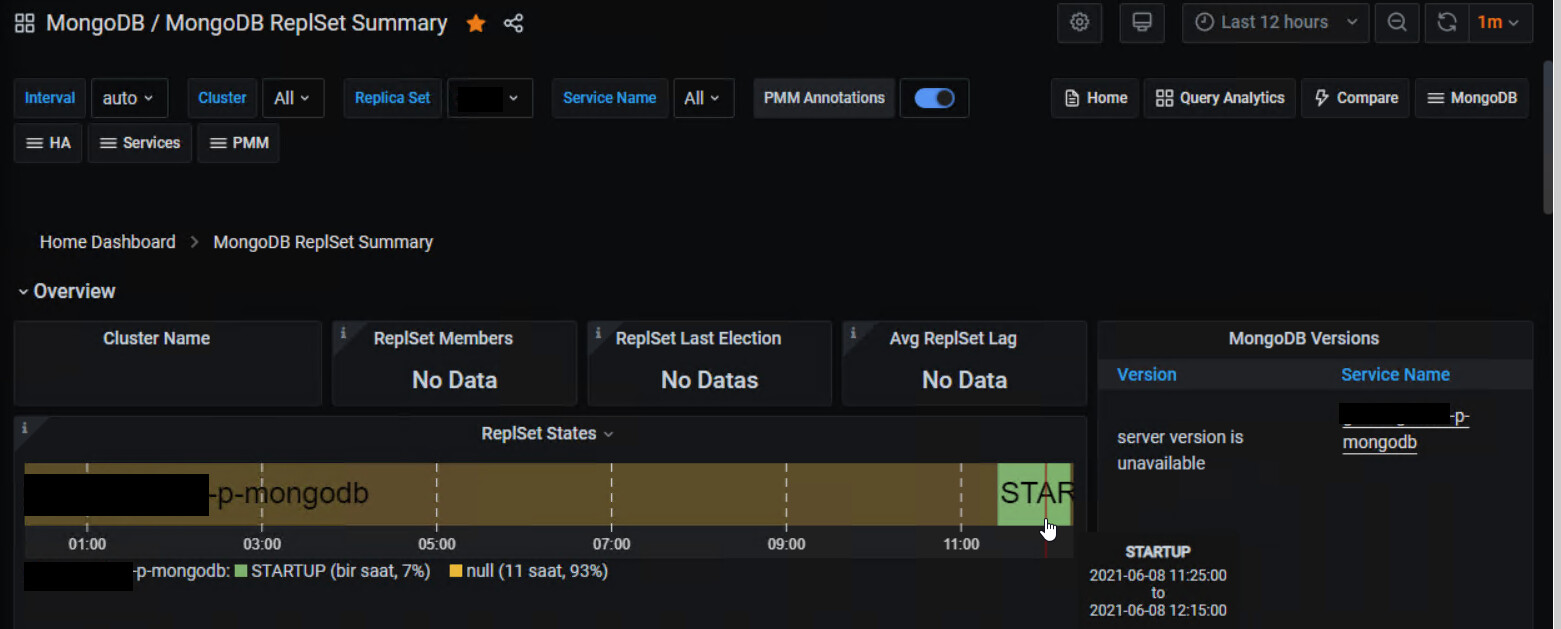
Do you see this STARTUP status permanently for replica or for the specific time range? can change time range and test for 5 mins, 30 mins, 1 hour , 3 hours etc see if status change.
Thank you for your reply, but 2.10 has the same problem
root@a0059n1:~# /usr/local/percona/pmm2/exporters/mongodb_exporter --version

mongodb_exporter - MongoDB Prometheus exporter

Version: c31c7f7fd636ec18ad0fa4a78549fcdeee82cfdb

Commit: c31c7f7fd636ec18ad0fa4a78549fcdeee82cfdb

Build date: 2020-09-15T17:16:46+0000

root@a0059n1:~# systemctl restart pmm-agent

root@a0059n1:~# curl -s -u pmm:/agent_id/f2e8e21c-5ca0-4f9f-bd6f-4c92767ffc27 <a href="http://localhost:42002/metrics">http://localhost:42002/metrics</a> | grep mongodb_version

# HELP mongodb_version_info The server version

# TYPE mongodb_version_info gauge

mongodb_version_info{mongodb="server version is unavailable"}
@lalit.choudhary yes, I tried with mentioned time frames but status was same. Problem still existed.
The problem still exist, any news about fixing?
@Cihan_Tunali
We verified this as a bug and PMM team will check this further.
The problem still exists in PMM 2.16…
@aihnatov
[PMM-7116] Dashboards: Incorrect STARTUP state on MongoDB ReplSet Summary dashboard - Percona JIRA still open and not yet fixed. Please subscribe to the bug by adding yourself to the watcher list and you get updates for the bug progress
Hello
At Get mongodb metrics error - #12 by Cihan_Tunali with @carlos.salguero help, I debugged his steps with Pmm 2.18 witvh Pmm2-client-2.18-0.
Here is mongodb_exporter version
I ran mongodb_exportore manually via
./mongodb_exporter --mongodb.uri=‘mongodb://user:pass@10.0.0.170:27017/admin’ --log.level=debug
Tested.
Still there is problem and it can not get correct data and PMM is not showing as well
https://jira.percona.com/browse/PMM-7116
Kindly require help, because of this, I can not update my PMM. Thanks!
Hello,
Anybody help me?
with @steve.hoffman help, I found that this problem fixed with v2.18. I tried to install v2.19 and I updated my agents to v.2.19. Problem still exist at this version as well.
I followed this article to setup agent but nothing changed at statuses. Can someone help please?
Unanswered | Unsolved | Solved
MySQL, InnoDB, MariaDB and MongoDB are trademarks of their respective owners.
Copyright © 2006 - 2024 Percona LLC. All rights reserved.