Is there a way to get the settings of an exporters? For example I want to get the settings of –disable-tablestats-limit and –max-query-length from mysqld_exporter
Hi @fredricj,
Go to the Inventory, and then expand the service you want to check (the down arrow under the options column) and click on the Agents link:
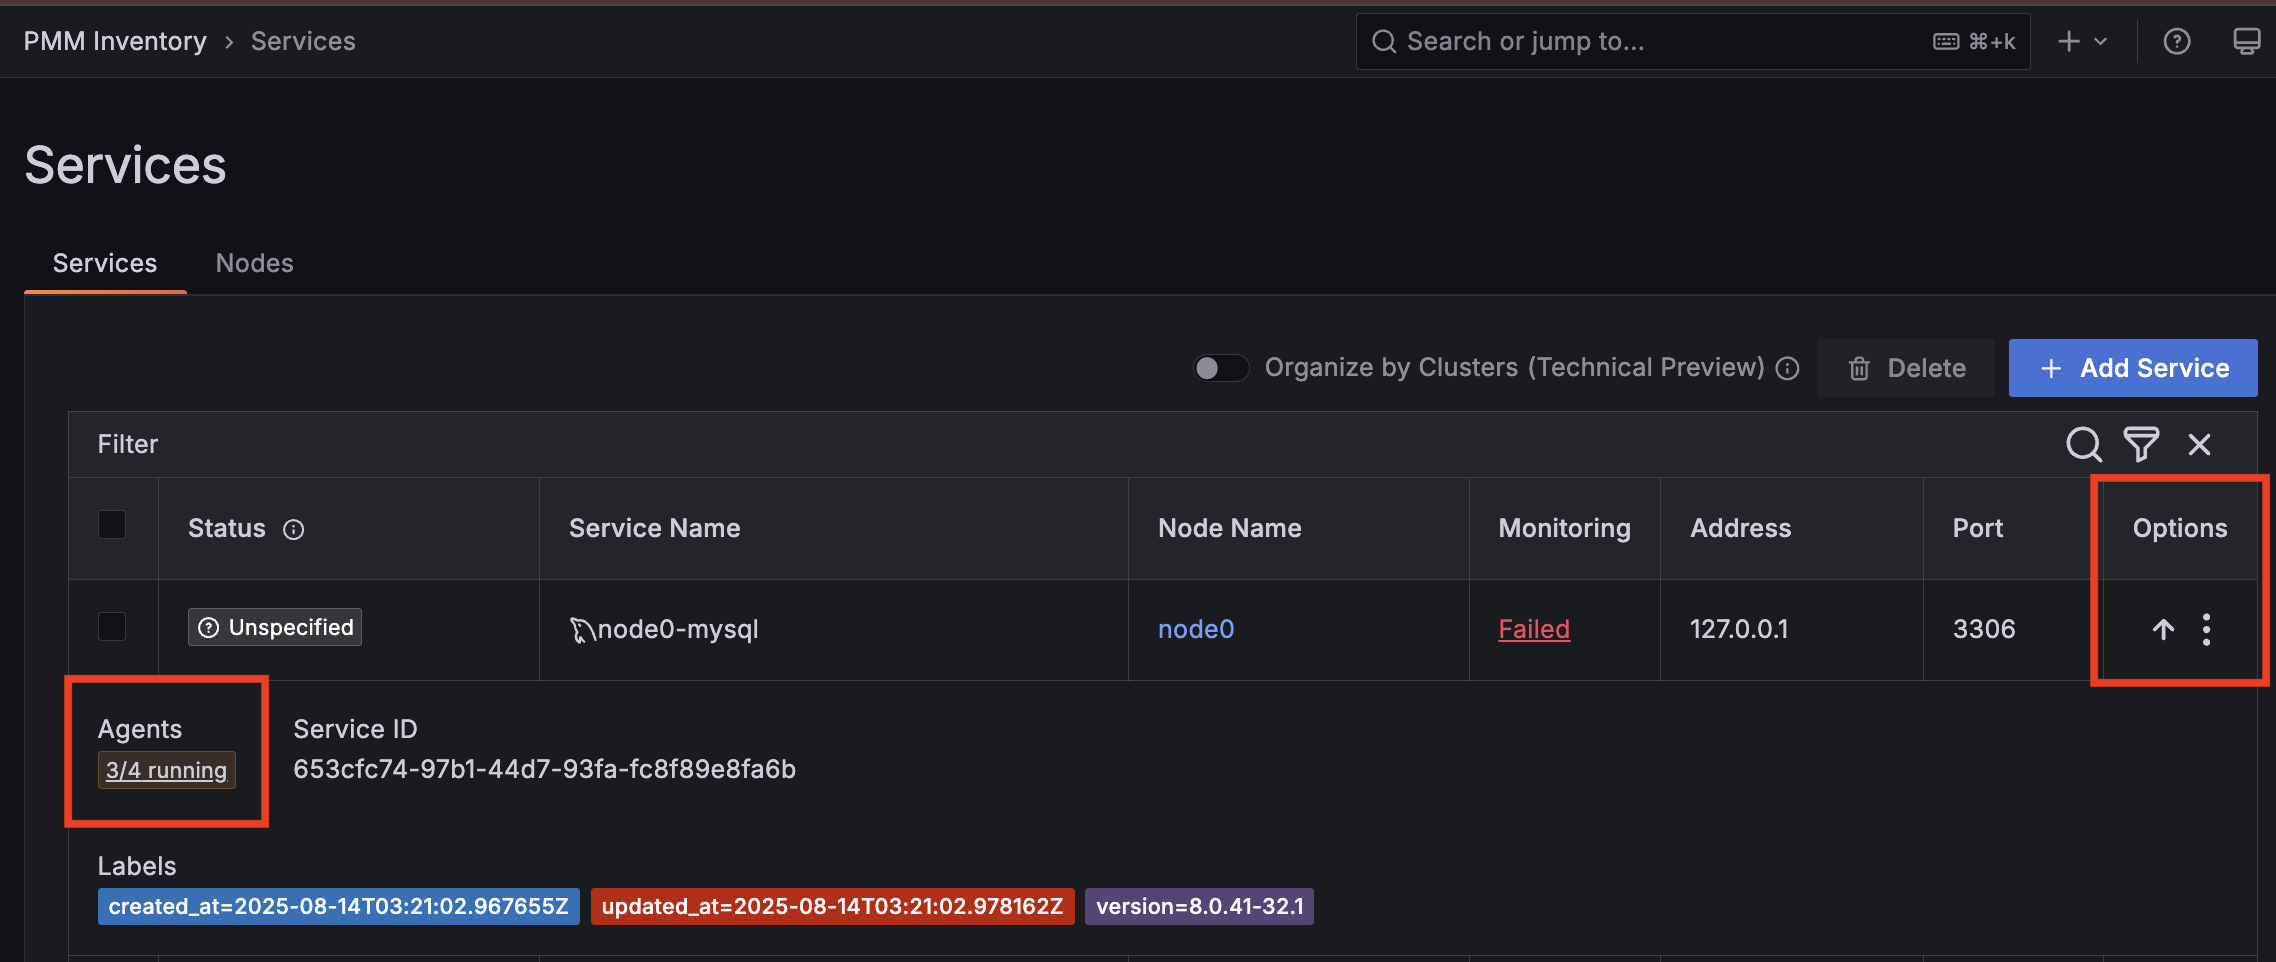
Then expand the agent you want to check (again the down arrow in the options column):

You should see some metadata there.
Let me know if that works.
Thanks, that works.
Imagine if I want to retrieve this information for multiple server or automatically, for instance for use in an ansible playbook. Is there currently a way to do that?
Hello @fredricj
PMM does provide a list of comprehensive REST API endpoints for you to be able to interact with the PMM server programmatically. The documentation for it can be found here: About PMM API - Percona Monitoring and Management
Here is what it looks like when retrieving the data using the REST API versus viewing it on the PMM Web UI
- Using API
% curl -H "Authorization: Bearer ${PMM_AUTH_TOKEN}" -k "${PMM_URL}/v1/management/agents?service_id=7a8727b1-b76f-41a0-ad63-72fba2ebf54d" |jq -r '.agents[0]'
  % Total    % Received % Xferd  Average Speed   Time    Time     Time  Current
                                 Dload  Upload   Total   Spent    Left  Speed
100  5785    0  5785    0     0  86618      0 --:--:-- --:--:-- --:--:-- 87651
{
  "agent_id": "442cccb7-f117-403b-a2a4-9cdbc8fd7a71",
  "is_agent_password_set": false,
  "agent_type": "mysqld_exporter",
  "aws_access_key": "",
  "is_aws_secret_key_set": false,
  "azure_options": null,
  "created_at": "2025-09-12T02:19:26.723378Z",
  "custom_labels": {},
  "disabled": false,
  "disabled_collectors": [],
  "listen_port": 42002,
  "log_level": "LOG_LEVEL_UNSPECIFIED",
  "max_query_length": 0,
  "max_query_log_size": "0",
  "metrics_path": "",
  "metrics_scheme": "",
  "mongo_db_options": null,
  "mysql_options": {
    "is_tls_key_set": false
  },
  "node_id": "",
  "is_password_set": true,
  "pmm_agent_id": "7694095f-b82a-4ff9-a3ea-2f788670c8c3",
  "postgresql_options": null,
  "process_exec_path": "/usr/local/percona/pmm/exporters/mysqld_exporter",
  "push_metrics": true,
  "query_examples_disabled": false,
  "comments_parsing_disabled": false,
  "rds_basic_metrics_disabled": false,
  "rds_enhanced_metrics_disabled": false,
  "runs_on_node_id": "",
  "service_id": "7a8727b1-b76f-41a0-ad63-72fba2ebf54d",
  "status": "AGENT_STATUS_RUNNING",
  "table_count": 345,
  "table_count_tablestats_group_limit": -1,
  "tls": false,
  "tls_skip_verify": false,
  "username": "pmm",
  "updated_at": "2025-09-12T02:19:28.994018Z",
  "version": "0.17.2",
  "is_connected": false,
  "expose_exporter": false
}
```
- Viewing it on the web:

As for your question:
Imagine if I want to retrieve this information for multiple server or automatically, for instance for use in an ansible playbook. Is there currently a way to do that?
Using the REST APIs, we can achieve this by:
- Retrieve the list of services registered with PMM Server
- Retrieve the list of agents associated with said services
Here is a simple Bash snippet to get the info of agents by registered services
export PMM_AUTH_TOKEN="<your PMM Server Grafana Service Account token>"
export PMM_URL="https://localhost"

curl -H "Authorization: Bearer ${PMM_AUTH_TOKEN}" -k "${PMM_URL}/v1/management/services" | jq -rc '.services[] | {service_id: .service_id,service_type:.service_type,service_name:.service_name}' | while read -r line
do
    echo ""
    echo "## agents associated with service: ${line}"
    svc_id="$(echo "${line}" | jq -r '.service_id')"
    curl -H "Authorization: Bearer ${PMM_AUTH_TOKEN}" -k "${PMM_URL}/v1/management/agents?service_id=${svc_id}"
done
Let me know if it works for you