I tried adding external-serverless for monitoring some kafka broker as they are already exposing prometheus endpoints from MSK Open-Monitoring
pmm-admin add external-serverless runs and give success message but I am not able to see any metrics in the explorer tab
Not sure how can I debug this.
Please help me if someone is aware about this issue
I am deploying it on a container running on EKS node
Here is the general data flow for the architecture
(MSK) → DEV EKS (POD) (External serverless services) → EKS (POD) (Pmm-server)
Please provide the full command used to add the external monitoring. Have you looked at journalctl for any errors from the pmm-agent?
I have not deployed pmm as systemd service as these are running on lightweight pods so didn’t want to mess with that
and as of the full command that I am using is as follows
pmm-admin add external-serverless --debug --url="http://broker-url.com:11001/metrics"--group=kafka
Just replacing the broker-url with the actual broker URL
and already checked the connectivity with the pod(pmm-kafka) to broker is there as well as pod(pmm-server) to broker is also there
What do the pmm-agent logs say, during add external-serverless and after adding?
on the pod I get the confirmation like
External Service added.
Service ID : <service_id>
Service name: test-service
Group : external
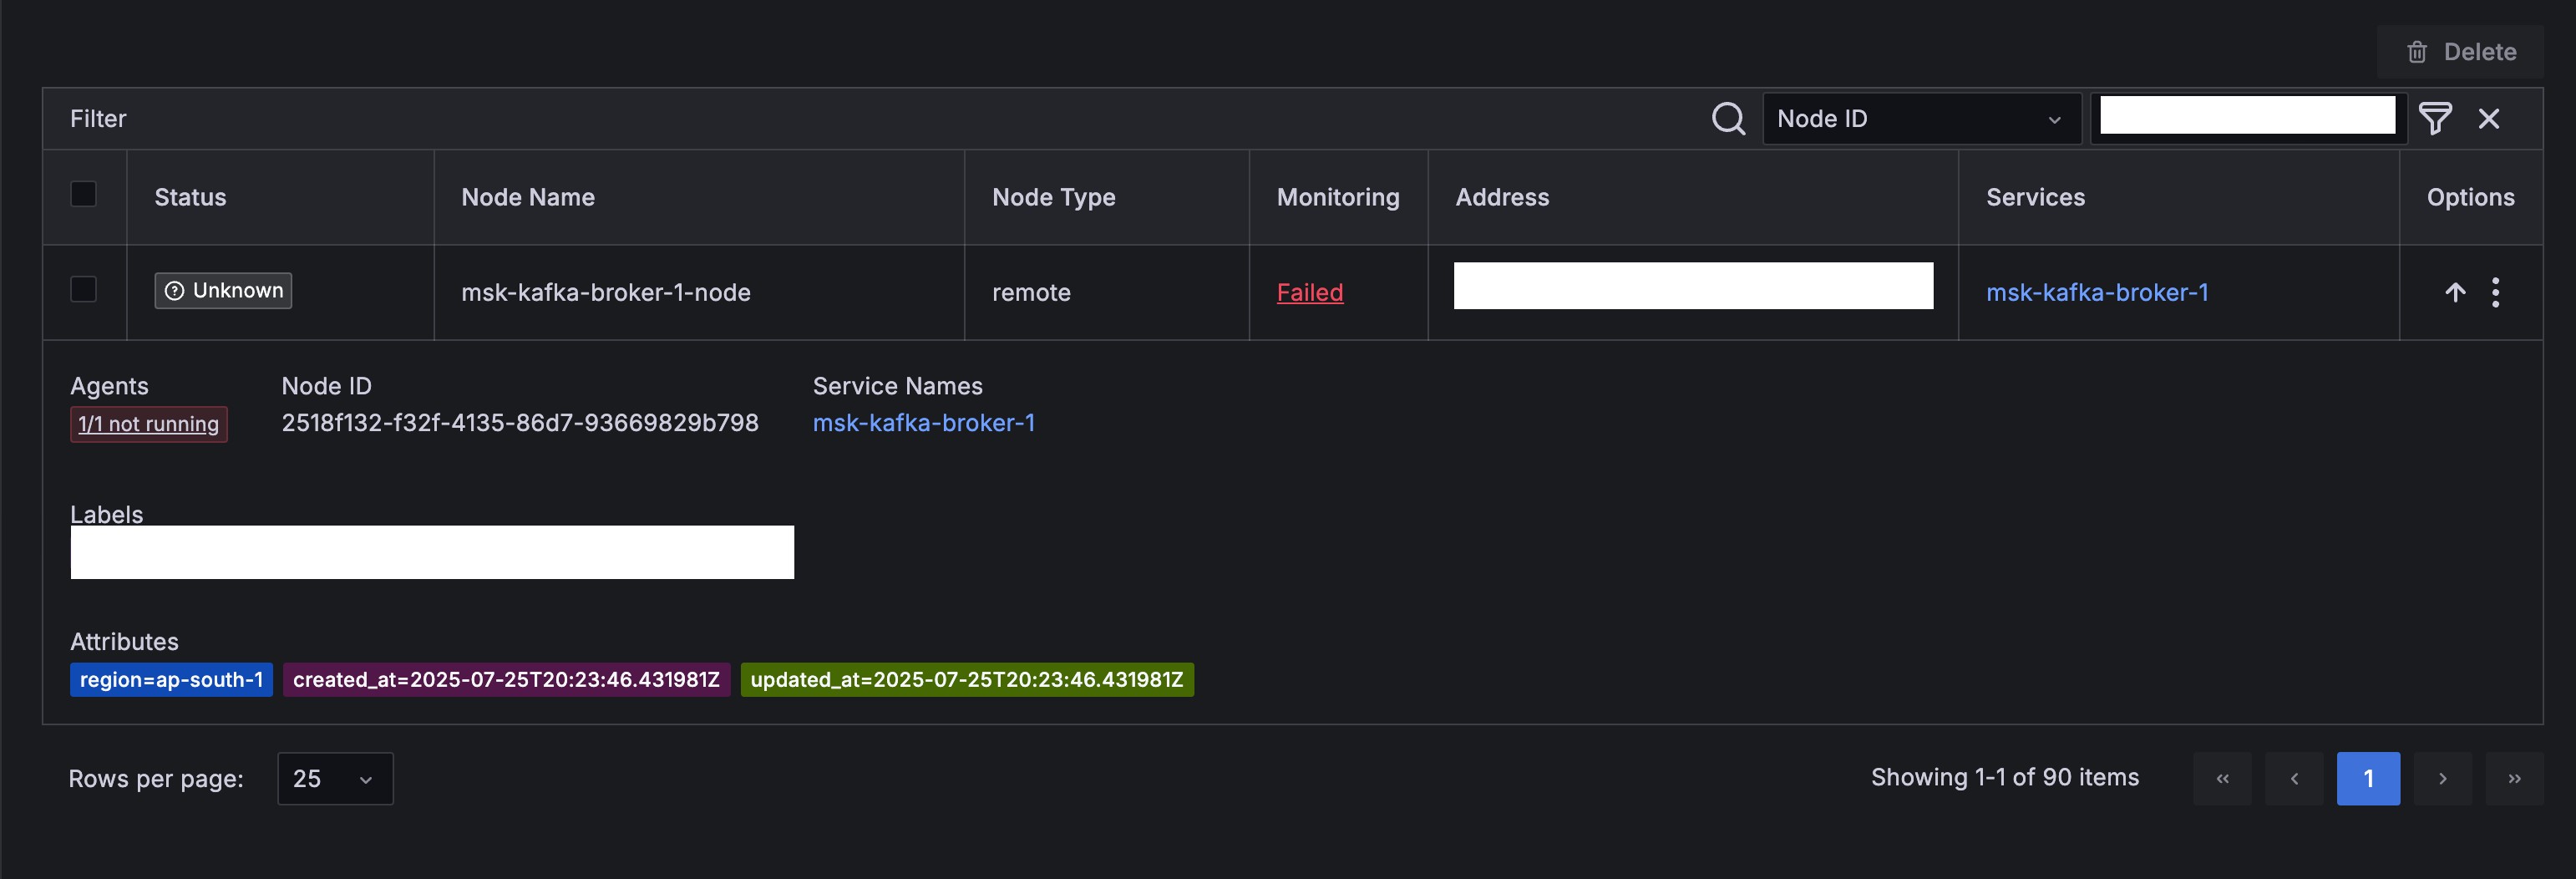
but on the console it registers a new node that is not there and don’t have any agents running
msk-kafka-broker-1-node remote [Failed]
[1/1 not running] /agents)
Node ID: node_id
Service Names
[msk-kafka-broker-1]
here is an example of test service that got added