MySQL: Server version: 5.7.35-38-log Percona Server (GPL), Release ‘38’, Revision ‘3692a61’
mysql> show variables like ‘%slow%’;
±----------------------------------±-----------------------------------+
| Variable_name | Value |
±----------------------------------±-----------------------------------+
| log_slow_admin_statements | OFF |
| log_slow_filter | |
| log_slow_rate_limit | 1 |
| log_slow_rate_type | session |
| log_slow_slave_statements | OFF |
| log_slow_sp_statements | ON |
| log_slow_verbosity | |
| max_slowlog_files | 0 |
| max_slowlog_size | 0 |
| slow_launch_time | 2 |
| slow_query_log | OFF |
| slow_query_log_always_write_time | 10.000000 |
| slow_query_log_file | /var/lib/mysql/db-mysql-1-slow.log |
| slow_query_log_use_global_control | |
±----------------------------------±-----------------------------------+
PMM: 3.3.1
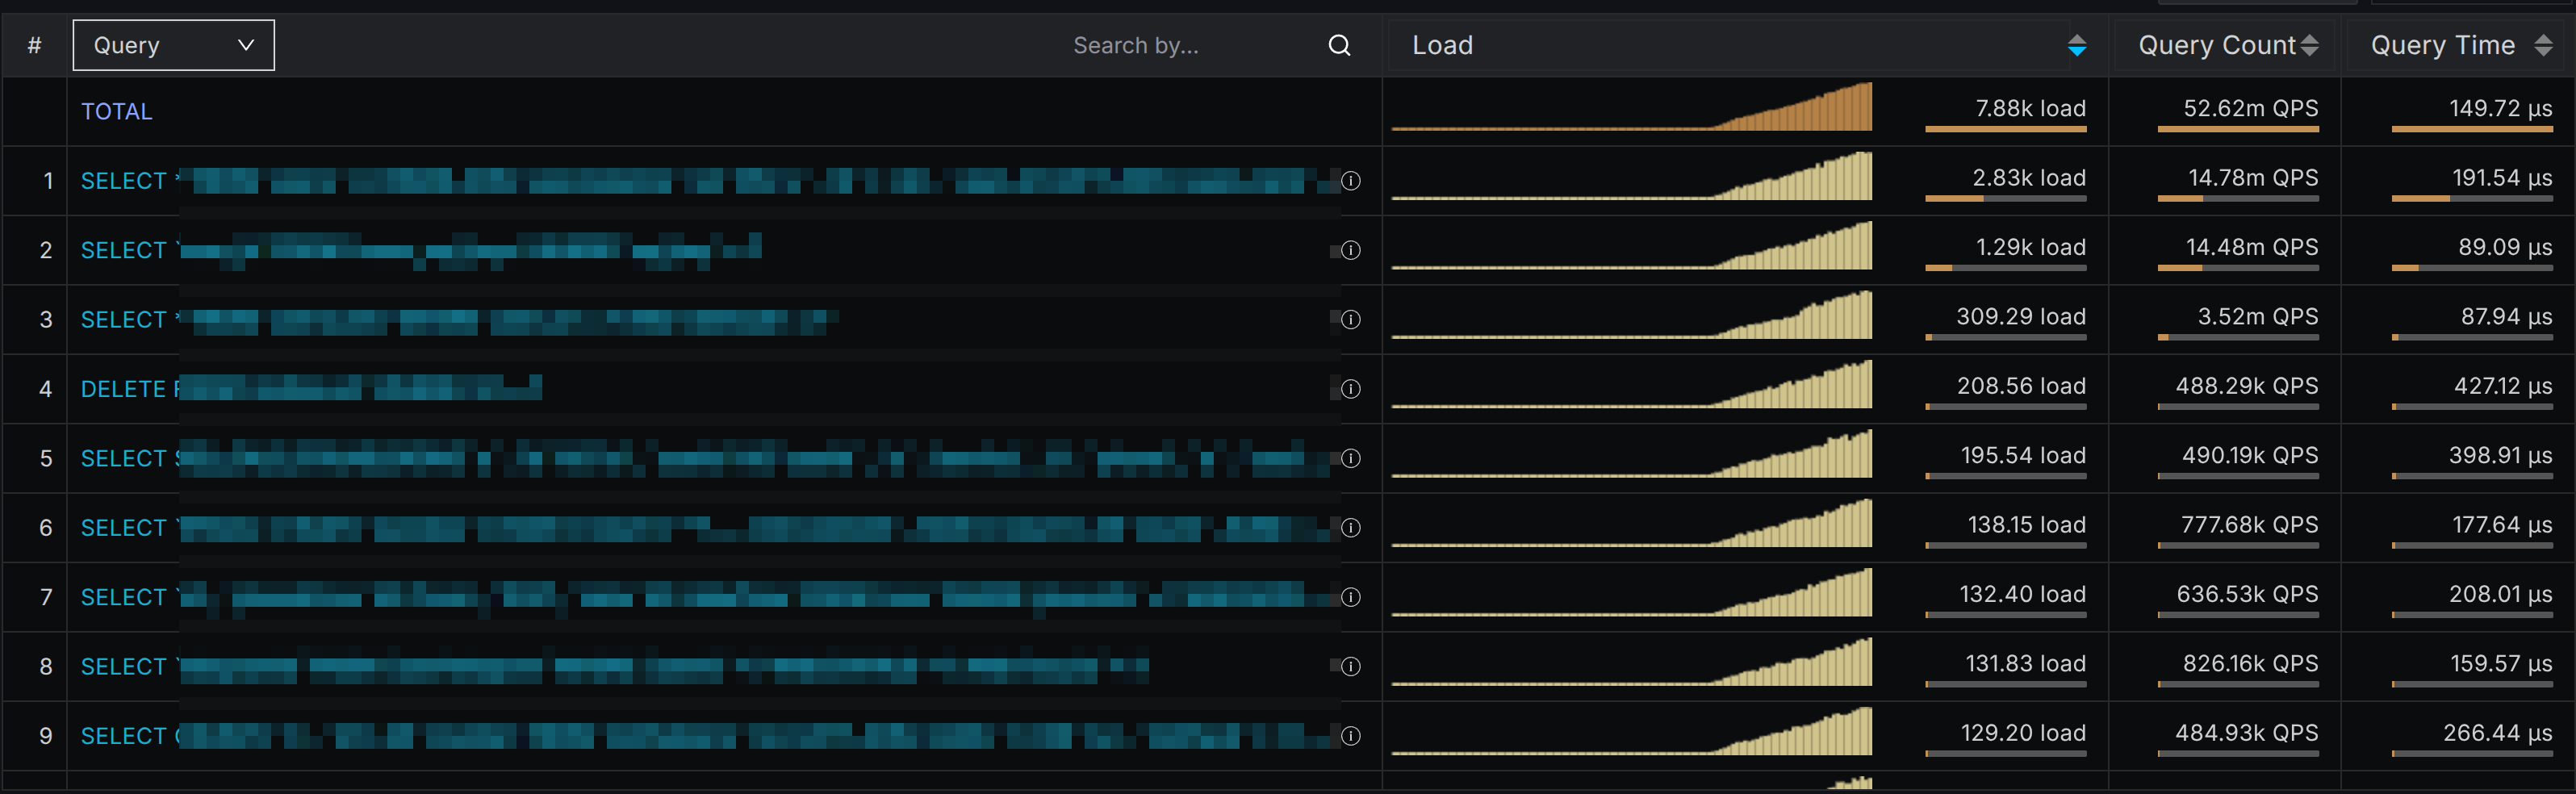
QAN:
Query Count: 45.37m QPS
Rows Sent: 45.31m (per sec)
This is nonsense.
We have absurdly high query counts and load level in QAN.
Real load: 10k-30k.
Previous issue: performance_schema.events_statements_summary_by_digest table overflowed, stuck at 10k records for six months (performance_schema_digests_size = 10k).
Fixed by increasing performance_schema_digests_size and restarting the server (table cleared).
Since then, QAN load gradually rises to unrealistic levels.