Hello! I have a Percona xtradb Cluster 8.0.42-33.1 cluster installed using percona-operator 1.18.0. I’ve noticed a steady increase in the number of rows in performance_schema.mutex_instances with NAME=wait/synch/mutex/sql/MDL_ticket_store::LOCK_ticket_store_ops. It’s growing by 250K rows per day. There’s almost no load on the cluster. What could be causing this?
It seems this mutex keep tracks of MDL ticket and manage access to the metadata locks currently held by a thread. I don’t see any specific bugs report related to this behaviour.
NAME=wait/synch/mutex/sql/MDL_ticket_store::LOCK_ticket_store_ops.
Did you ran any DDL/Alter operations or using quite a high parallel threads ? Do you have the output of SHOW FULL PROCESSLIST and SHOW ENGINE INNODB STATUS\G ?
The MDL locks if held any can be monitored using below query.
select m.*, t.PROCESSLIST_ID
from performance_schema.metadata_locks m JOIN
performance_schema.threads t ON m.OWNER_THREAD_ID = t.THREAD_ID
where t.PROCESSLIST_ID = <PROCESSLIST_ID> ;
select * from sys.schema_table_lock_waits \G
Similarly for any innodb row locks you can use the below query to get the information.
SELECT
 waiting_trx_id,
 waiting_pid,
 waiting_query,
 blocking_trx_id,
 blocking_pid,
 blocking_query
 FROM sys.innodb_lock_waits;
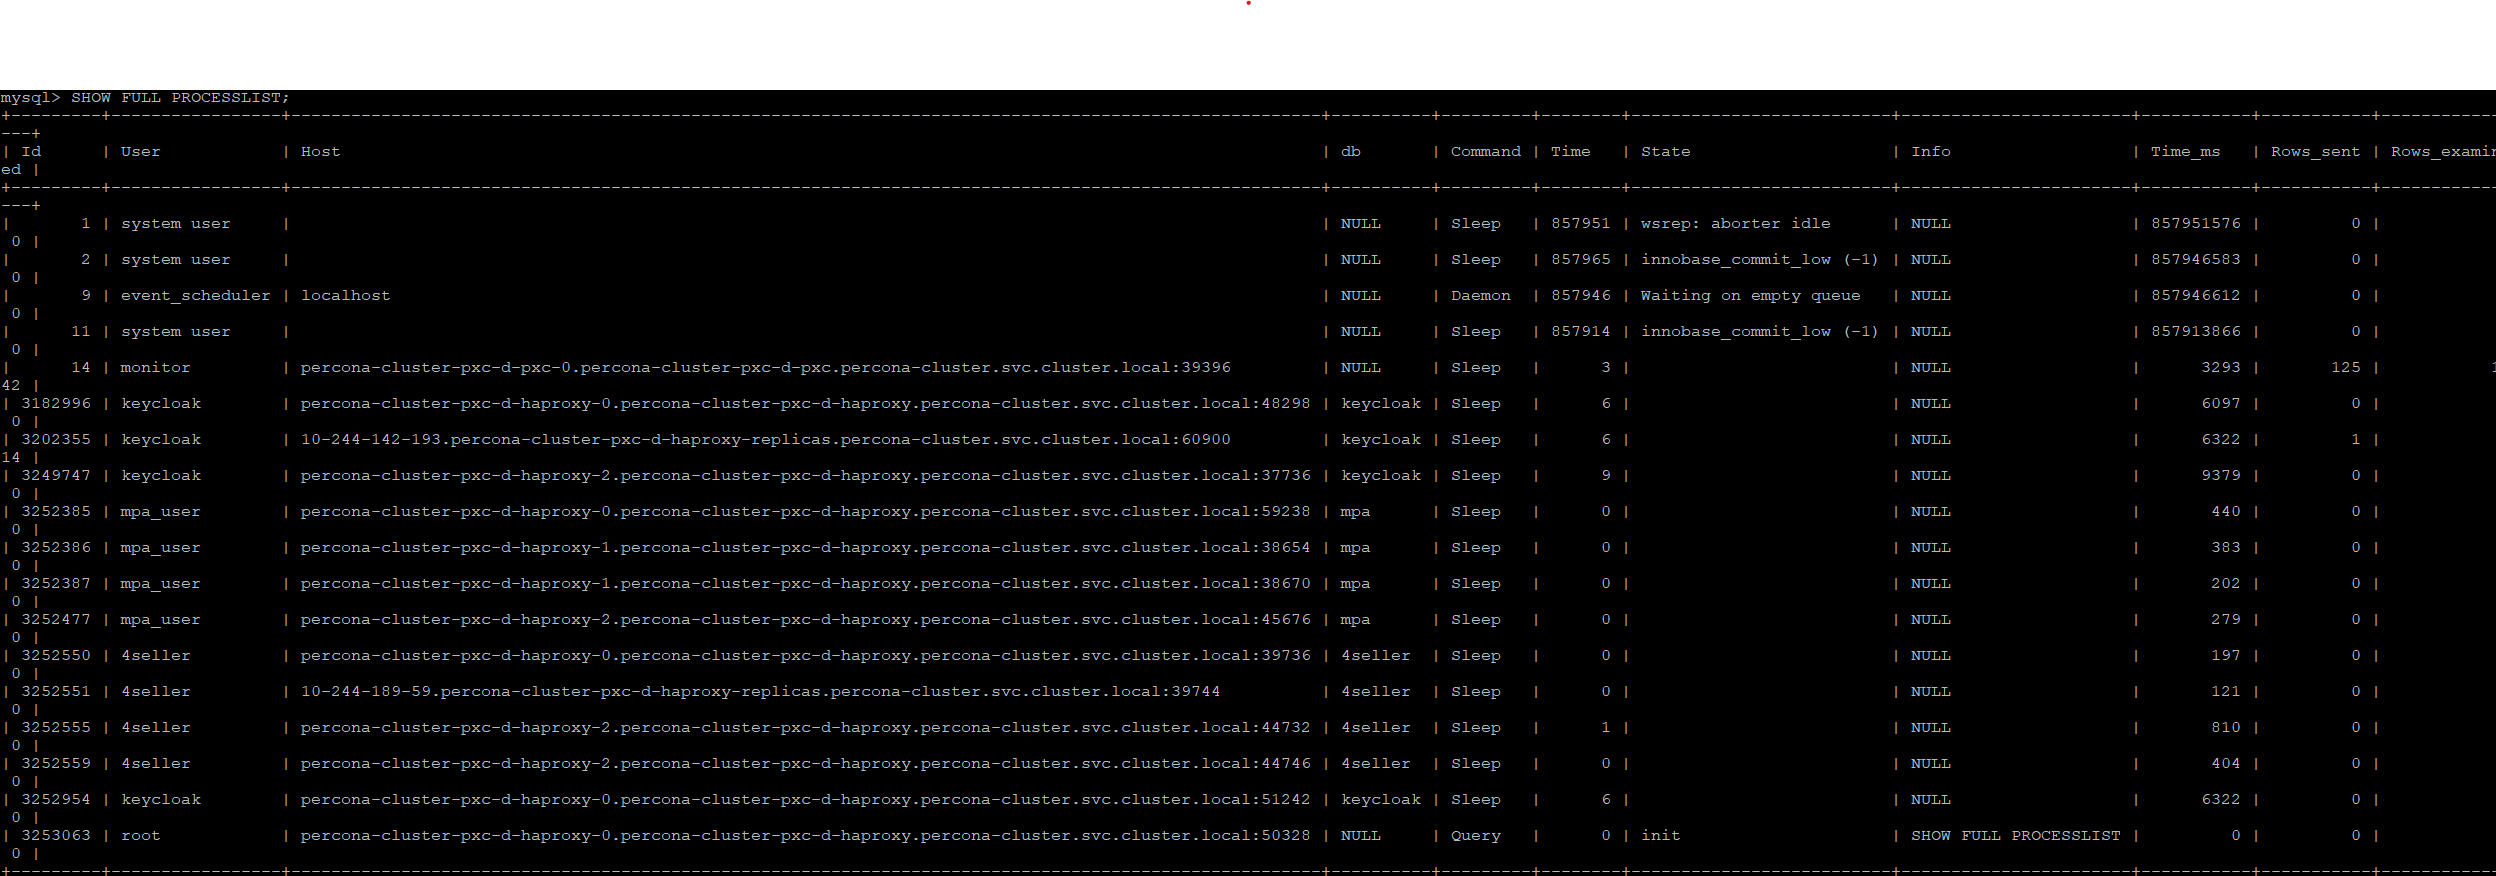
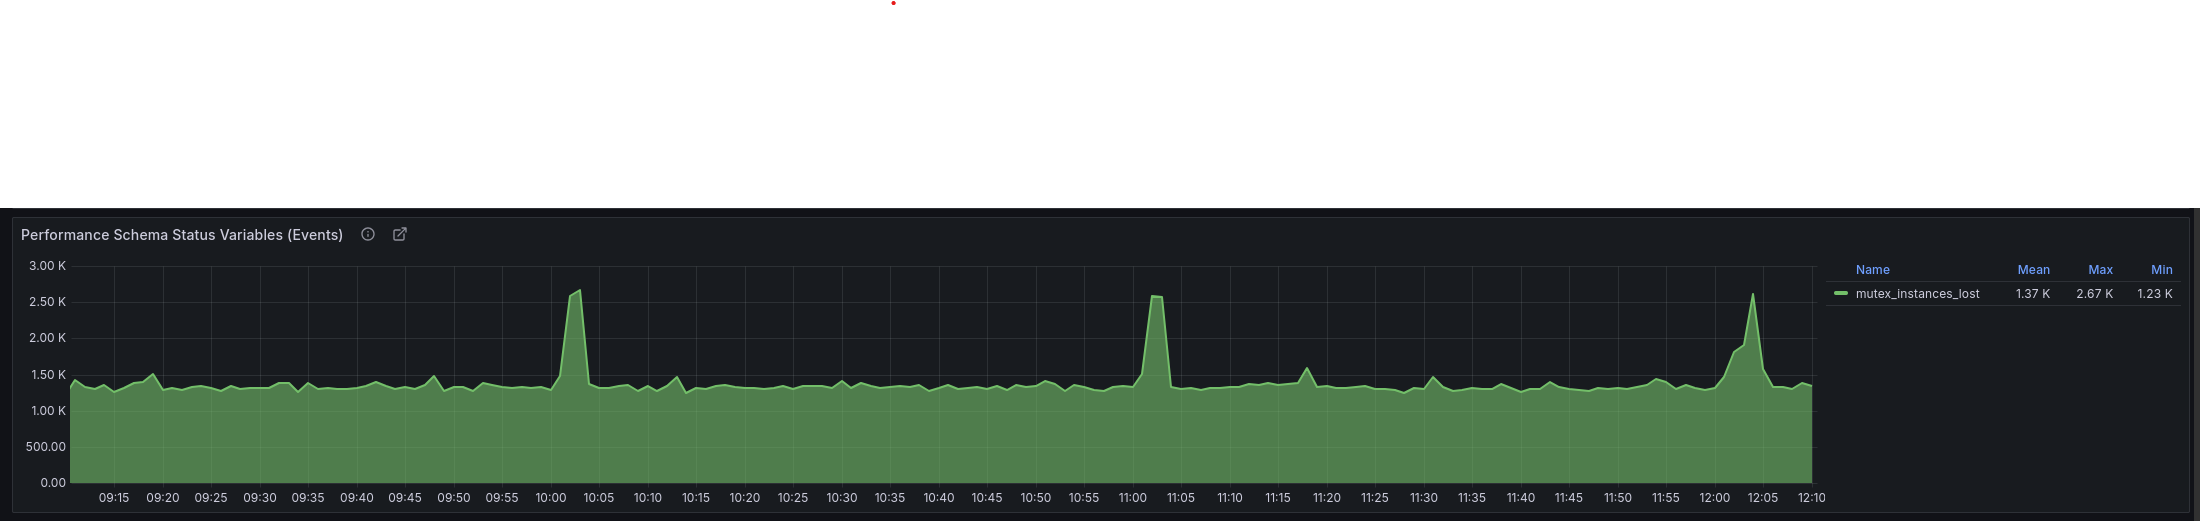
Anil.joshi, thank you for taking the time to address my issue! Alter table queries aren’t executed in large numbers (only when deploying multiple applications, if there are migrations, but these are rare per week). Currently, the SHOW FULL PROCESSLIST query doesn’t show any load (see screenshot). The select * from sys.schema_table_lock_waits \G and SELECT * FROM sys.innodb_lock_waits; queries also return nothing. I’ve attached the output of SHOW ENGINE INNODB STATUS \G to my message. Currently, insert attempts continue into the performance_schema.mutex_instances table (I added the performance_schema_max_mutex_instances = 20000 parameter to limit the constant growth of this table). I’ve also attached a screenshot from PMM, which shows that inserts into performance_schema.mutex_instances are ongoing.
innodb_status.txt (95.0 KB)
I tested with the same PXC operator version 1.18 (8.0.42) and can confirm i am also seeing the similar behaviour.
mysql> select * from performance_schema.mutex_instances where name like '%LOCK_ticket_store_ops%';

| wait/synch/mutex/sql/MDL_ticket_store::LOCK_ticket_store_ops |       281468668736648 |                NULL |
| wait/synch/mutex/sql/MDL_ticket_store::LOCK_ticket_store_ops |       281468668736648 |                NULL |
| wait/synch/mutex/sql/MDL_ticket_store::LOCK_ticket_store_ops |       281469943693784 |                NULL |
| wait/synch/mutex/sql/MDL_ticket_store::LOCK_ticket_store_ops |       281468872300936 |                NULL |
| wait/synch/mutex/sql/MDL_ticket_store::LOCK_ticket_store_ops |       281468668736648 |                NULL |
| wait/synch/mutex/sql/MDL_ticket_store::LOCK_ticket_store_ops |       281469943693784 |                NULL |
| wait/synch/mutex/sql/MDL_ticket_store::LOCK_ticket_store_ops |       281469943693784 |                NULL |
| wait/synch/mutex/sql/MDL_ticket_store::LOCK_ticket_store_ops |       281469943693784 |                NULL |
| wait/synch/mutex/sql/MDL_ticket_store::LOCK_ticket_store_ops |       281468872300936 |                NULL |
| wait/synch/mutex/sql/MDL_ticket_store::LOCK_ticket_store_ops |       281468668736648 |                NULL |
+--------------------------------------------------------------+-----------------------+---------------------+
1224 rows in set (0.00 sec)
…
| wait/synch/mutex/sql/MDL_ticket_store::LOCK_ticket_store_ops |       281468872300936 |                NULL |
| wait/synch/mutex/sql/MDL_ticket_store::LOCK_ticket_store_ops |       281468668736648 |                NULL |
| wait/synch/mutex/sql/MDL_ticket_store::LOCK_ticket_store_ops |       281469943693784 |                NULL |
| wait/synch/mutex/sql/MDL_ticket_store::LOCK_ticket_store_ops |       281469943693784 |                NULL |
| wait/synch/mutex/sql/MDL_ticket_store::LOCK_ticket_store_ops |       281469943693784 |                NULL |
| wait/synch/mutex/sql/MDL_ticket_store::LOCK_ticket_store_ops |       281468872300936 |                NULL |
| wait/synch/mutex/sql/MDL_ticket_store::LOCK_ticket_store_ops |       281468668736648 |                NULL |
+--------------------------------------------------------------+-----------------------+---------------------+
1237 rows in set (0.00 sec)
This seems to part of a health check where the session connects and monitor the cluster node. Are you facing any issues/challenges due to this ?
mysql> show processlist;
+------+----------------------+--------------------------------------------------------------------------+------+---------+------+--------------------------+------------------+---------+-----------+---------------+
| Id   | User                 | Host                                                                     | db   | Command | Time | State                    | Info             | Time_ms | Rows_sent | Rows_examined |
+------+----------------------+--------------------------------------------------------------------------+------+---------+------+--------------------------+------------------+---------+-----------+---------------+
|    1 | system user          |                                                                          | NULL | Sleep   | 1094 | wsrep: aborter idle      | NULL             | 1093398 |         0 |             0 |
|    2 | system user          |                                                                          | NULL | Sleep   | 1094 | innobase_commit_low (-1) | NULL             | 1093398 |         0 |             0 |
|    8 | event_scheduler      | localhost                                                                | NULL | Daemon  | 1094 | Waiting on empty queue   | NULL             | 1093148 |         0 |             0 |
|   11 | system user          |                                                                          | NULL | Sleep   | 1094 | wsrep: applier idle      | NULL             | 1093142 |         0 |             0 |
|  480 | root                 | cluster1-haproxy-0.cluster1-haproxy.pxc-operator.svc.cluster.local:52740 | NULL | Query   |    0 | init                     | show processlist |       0 |         0 |             0 |
**| 2223 | unauthenticated user | cluster1-haproxy-0.cluster1-haproxy.pxc-operator.svc.cluster.local:46356 | NULL | Connect |    0 | login                    | NULL             |      42 |         0 |             0 |**
+------+----------------------+--------------------------------------------------------------------------+------+---------+------+--------------------------+------------------+---------+-----------+---------------+
6 rows in set, 1 warning (0.00 sec)
If you enable the general/audit logs you can see the exact connection details which keeps increasing as well. So this is part of internal process inside pxc operator.
|2025-11-14T12:52:31.003087Z| 4163 Connect|monitor@cluster1-haproxy-0.cluster1-haproxy.pxc-operator.svc.cluster.local on  using SSL/TLS|
|---|---|---|
|2025-11-14T12:52:32.042272Z| 4164 Connect|monitor@cluster1-haproxy-0.cluster1-haproxy.pxc-operator.svc.cluster.local on  using SSL/TLS|
|2025-11-14T12:52:33.591304Z| 4167 Query|SELECT User_attributes FROM mysql.user WHERE user='monitor'|
|2025-11-14T12:52:34.467195Z| 4170 Connect|monitor@cluster1-haproxy-0.cluster1-haproxy.pxc-operator.svc.cluster.local on  using SSL/TLS|
|2025-11-14T12:52:34.612264Z| 4171 Connect|monitor@cluster1-haproxy-0.cluster1-haproxy.pxc-operator.svc.cluster.local on mysql using SSL/TLS|
|2025-11-14T12:52:35.004880Z| 4174 Connect|monitor@cluster1-pxc-0.cluster1-pxc.pxc-operator.svc.cluster.local on  using SSL/TLS|
|2025-11-14T12:52:35.012697Z| 4175 Connect|monitor@cluster1-pxc-0.cluster1-pxc.pxc-operator.svc.cluster.local on  using SSL/TLS|
|2025-11-14T12:52:35.994163Z| 4176 Connect|monitor@cluster1-haproxy-0.cluster1-haproxy.pxc-operator.svc.cluster.local on  using SSL/TLS|
|2025-11-14T12:52:35.995179Z| 4177 Connect|monitor@cluster1-haproxy-0.cluster1-haproxy.pxc-operator.svc.cluster.local on  using SSL/TLS|
|2025-11-14T12:52:37.228619Z| 4178 Connect|monitor@cluster1-haproxy-0.cluster1-haproxy.pxc-operator.svc.cluster.local on  using SSL/TLS|
|2025-11-14T12:52:39.663399Z| 4181 Query|SELECT User_attributes FROM mysql.user WHERE user='monitor'|
|2025-11-14T12:52:39.756715Z| 4184 Connect|monitor@cluster1-haproxy-0.cluster1-haproxy.pxc-operator.svc.cluster.local on  using SSL/TLS|
Sorry for the long response.
Yes, the growing number of records in performance_schema.mutex_instances leads to serious problems, as each record in the performance_schema.mutex_instances table also creates a corresponding record in the performance_schema.events_waits_summary_global_by_event_name table. With PMM installed and the recommended settings, PMM makes a high-frequency query to the performance_schema.events_waits_summary_global_by_event_name table, which looks like this:
SELECT
EVENT_NAME,
COUNT_STAR,
SUM_TIMER_WAIT
FROM
performance_schema.events_waits_summary_global_by_event_name
The more records there are in the performance_schema.events_waits_summary_global_by_event_name table, the slower this query runs. Over time, this query itself starts to appear in the slow query log. For now, I’ve found a workaround by adding a setting to mysql.cnf:
performance_schema_max_mutex_instances = 20000