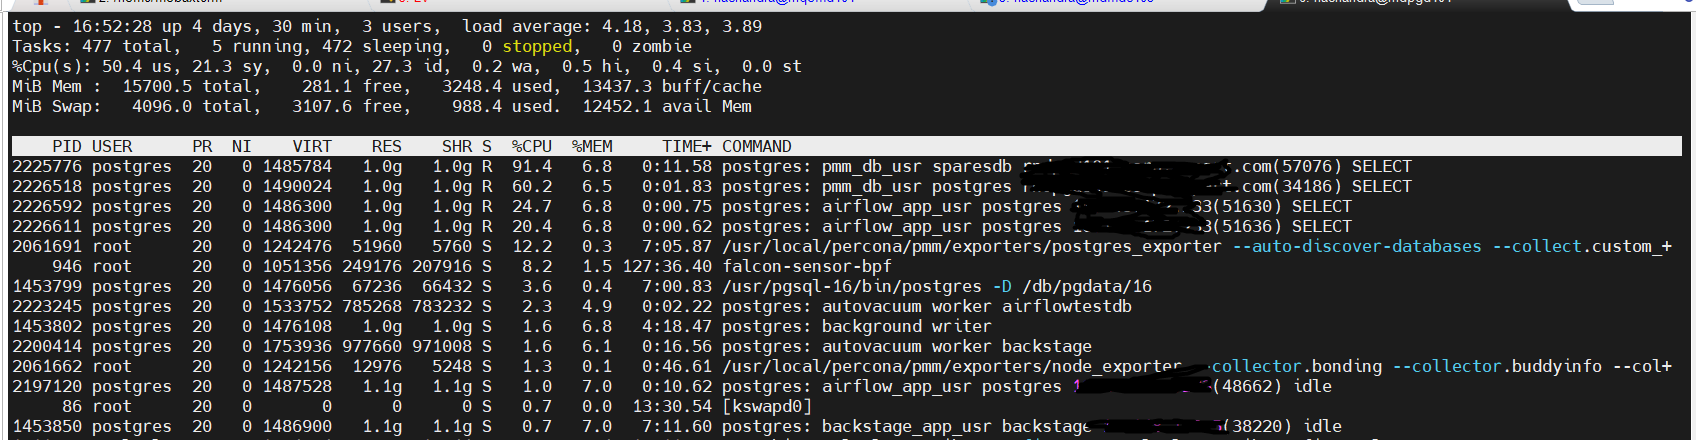
PMM agent queries are consuming high CPU, and I’m not sure why they are taking this much processing power. Can someone help me understand why these queries are continuously using high CPU on each database one after another?
PMM Server version: 3.2.0
Agent Version: 3.2.0
PostgreSQL version: 16
Hi Naresh,
To continue the investigation, I’d suggest you to use those PIDs to see the exact query being executed. For instance, for the first client you showed, get the PID from the first top column and use it in a query like:
postgres=# SELECT * FROM pg_stat_activity WHERE pid = 2225776;
Those outputs will show you the exact query text (under the query column), and you can then check which PMM client functionality is behind running it.
Hi @Agustin_G
Here are the details for the PID.
postgres=# SELECT * FROM pg_stat_activity WHERE pid = 3516805;
-[ RECORD 1 ]----±----------------------------------------------------------------
datid | 650116
datname | sparesdb
pid | 3516805
leader_pid |
usesysid | 16745
usename | pmm_db_usr
application_name |
client_addr | 10.2.8.8
client_hostname | rtestd101.corp.test.com
client_port | 54114
backend_start | 2025-11-19 04:07:13.129285+00
xact_start | 2025-11-19 04:07:13.148174+00
query_start | 2025-11-19 04:07:13.148174+00
state_change | 2025-11-19 04:07:13.148175+00
wait_event_type | LWLock
wait_event | BufferMapping
state | active
backend_xid |
backend_xmin | 540550322
query_id | -5198745557298908577
query | SELECT +
| current_database() datname, +
| schemaname, +
| relname, +
| seq_scan, +
| seq_tup_read, +
| idx_scan, +
| idx_tup_fetch, +
| n_tup_ins, +
| n_tup_upd, +
| n_tup_del, +
| n_tup_hot_upd, +
| n_live_tup, +
| n_dead_tup, +
| n_mod_since_analyze, +
| COALESCE(last_vacuum, ‘1970-01-01Z’) as last_vacuum, +
| COALESCE(last_autovacuum, ‘1970-01-01Z’) as last_autovacuum, +
| COALESCE(last_analyze, ‘1970-01-01Z’) as last_analyze, +
| COALESCE(last_autoanalyze, ‘1970-01-01Z’) as last_autoanalyze,+
| vacuum_count, +
| autovacuum_count, +
| analyze_count, +
| autoanalyze_count +
| FROM +
| pg_stat_user_tables +
|
backend_type | client backend
Time: 1.584 ms
postgres=#
postgres=# SELECT * FROM pg_stat_activity WHERE pid = 3522354;
-[ RECORD 1 ]----±-------------------------------------------------------------------------------------------------------------------------------------------------------------------------------------------------------------
datid | 650116
datname | sparesdb
pid | 3522354
leader_pid |
usesysid | 16745
usename | pmm_db_usr
application_name |
client_addr | 10.2.8.8
client_hostname | rtestd101.corp.test.com
client_port | 50624
backend_start | 2025-11-19 04:10:17.223482+00
xact_start | 2025-11-19 04:10:41.204441+00
query_start | 2025-11-19 04:10:41.204441+00
state_change | 2025-11-19 04:10:41.204444+00
wait_event_type | IO
wait_event | DataFileRead
state | active
backend_xid |
backend_xmin | 540551922
query_id | -2565669271273608176
query | SELECT current_database() datname, schemaname, relname, heap_blks_read, heap_blks_hit, idx_blks_read, idx_blks_hit, toast_blks_read, toast_blks_hit, tidx_blks_read, tidx_blks_hit FROM pg_statio_user_tables
backend_type | client backend
Time: 2.034 ms
postgres=#
Hi @Agustin_G
I can continuously see the two queries below when I check based on the PIDs.
SELECT
current_database() datname,
schemaname,
relname,
seq_scan,
seq_tup_read,
idx_scan,
idx_tup_fetch,
n_tup_ins,
n_tup_upd,
n_tup_del,
n_tup_hot_upd,
n_live_tup,
n_dead_tup,
n_mod_since_analyze,
COALESCE(last_vacuum, ‘1970-01-01Z’) as last_vacuum,
COALESCE(last_autovacuum, ‘1970-01-01Z’) as last_autovacuum,
COALESCE(last_analyze, ‘1970-01-01Z’) as last_analyze,
COALESCE(last_autoanalyze, ‘1970-01-01Z’) as last_autoanalyze,
vacuum_count,
autovacuum_count,
analyze_count,
autoanalyze_count
FROM
pg_stat_user_tables;
SELECT current_database() datname, schemaname, relname, heap_blks_read, heap_blks_hit, idx_blks_read, idx_blks_hit, toast_blks_read, toast_blks_hit, tidx_blks_read, tidx_blks_hit FROM pg_statio_user_tables;
nurlan
November 19, 2025, 12:04pm
7
Hi Naresh, seems like you have a lot of tables which creates huge response and my recommendation would be to remove these queries from custom queries list.
Hi @nurlan
Thanks for the reply.
Is there any alternative solution for this issue? Otherwise, we will lose the monitoring, right?