Server version: 5.7.33-36-57 Percona XtraDB Cluster (GPL), Release rel36, Revision a1ed9c3, WSREP version 31.49, wsrep_31.49
My cluster is 3 nodes. Sometimes inserts or updates are very slow, exactly 30 seconds.
I’m not sure why this happens sometimes,Their state usually stays in the state of “wsrep in pre-commit stage”.
Looking at the logs of other nodes, only found [Warning] WSREP: Failed to report last committed 206542947, -110 (Connection timed out).
Can anyone tell me what is causing this, and if any other information is needed please let me know.
You’ve got connectivity issues between your nodes. Connections between your nodes are timing out. Make sure all necessary ports are open (disable firewalls, iptables, etc) between all nodes (4567, 4444, 4568, 3306).
All ports are open normally and there are usually no problems connecting. This warning only happens occasionally, I don’t understand why? Sometimes I don’t have this warning yet, but inserting is also slow, why?
[mysqld]
server-id=1
datadir=/srv/mysql
socket=/var/run/mysqld/mysqld.sock
log-error=/var/log/mysqld.log
pid-file=/var/run/mysqld/mysqld.pid
log_slave_updates
expire_logs_days=7

# Path to Galera library
wsrep_provider=/usr/lib/libgalera_smm.so

# Cluster connection URL contains IPs of nodes
#If no IP is found, this implies that a new cluster needs to be created,
#in order to do that you need to bootstrap this node
wsrep_cluster_address=gcomm://104.xx.xx.xx,35.xx.xx.xx,104.xx.xx.xx
# In order for Galera to work correctly binlog format should be ROW
binlog_format=ROW

# MyISAM storage engine has only experimental support
default_storage_engine=InnoDB

# Slave thread to use
wsrep_slave_threads= 8

wsrep_log_conflicts

# This changes how InnoDB autoincrement locks are managed and is a requirement for Galera
innodb_autoinc_lock_mode=2

# Node IP address
#wsrep_node_address=192.xx.xx.xx
# Cluster name
wsrep_cluster_name=pxc-cluster

#If wsrep_node_name is not specified,  then system hostname will be used
wsrep_node_name=xx

#pxc_strict_mode allowed values: DISABLED,PERMISSIVE,ENFORCING,MASTER
pxc_strict_mode=ENFORCING

# SST method
wsrep_sst_method=xtrabackup-v2
That’s your entire my.cnf? I don’t see any config for innodb buffer pool nor for redo logs which means you are using the defaults. The defaults are horrible. Look for some MySQL basics tuning blogs for those and other parameters to modify.
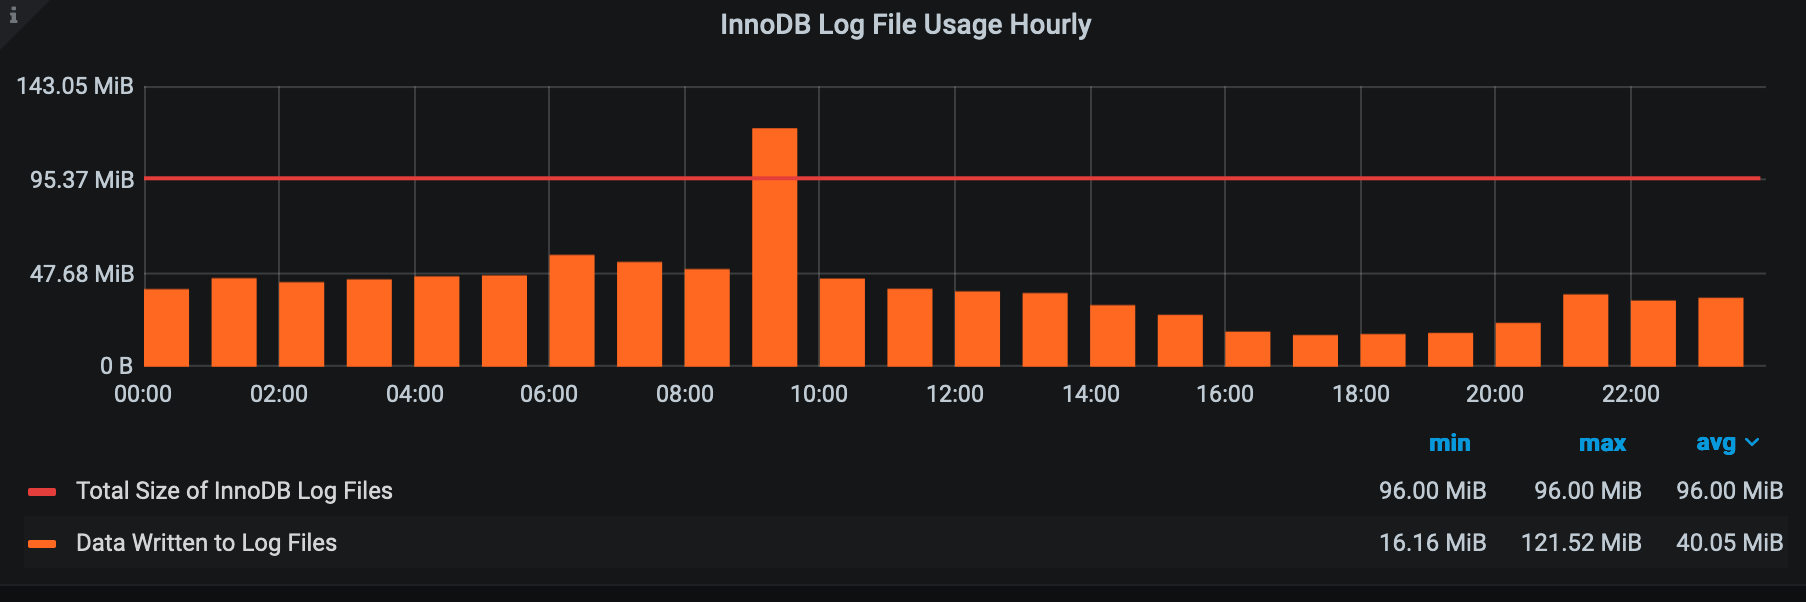
The bottom graph shows an issue. You see where the bar graph goes ABOVE the red line? That’s a problem. As I said above, it means your my.cnf parameters are not properly tuned.