Hi All,
How can we create custom QAN dashboard? We would like to create a dash board like Top 10 slow queries or top 20 slow queries in the custom dashboard.
Hi All,
How can we create custom QAN dashboard? We would like to create a dash board like Top 10 slow queries or top 20 slow queries in the custom dashboard.
Thanks for the quick help.
When I am trying to run the query then I am getting the below error.
Code: 60, e.displayText() = DB::Exception: Table default.undefined doesn’t exist (version 21.3.20.1 (official build))
Could you check a generated SQL request?

Sorry its my bad, Thanks for the help.
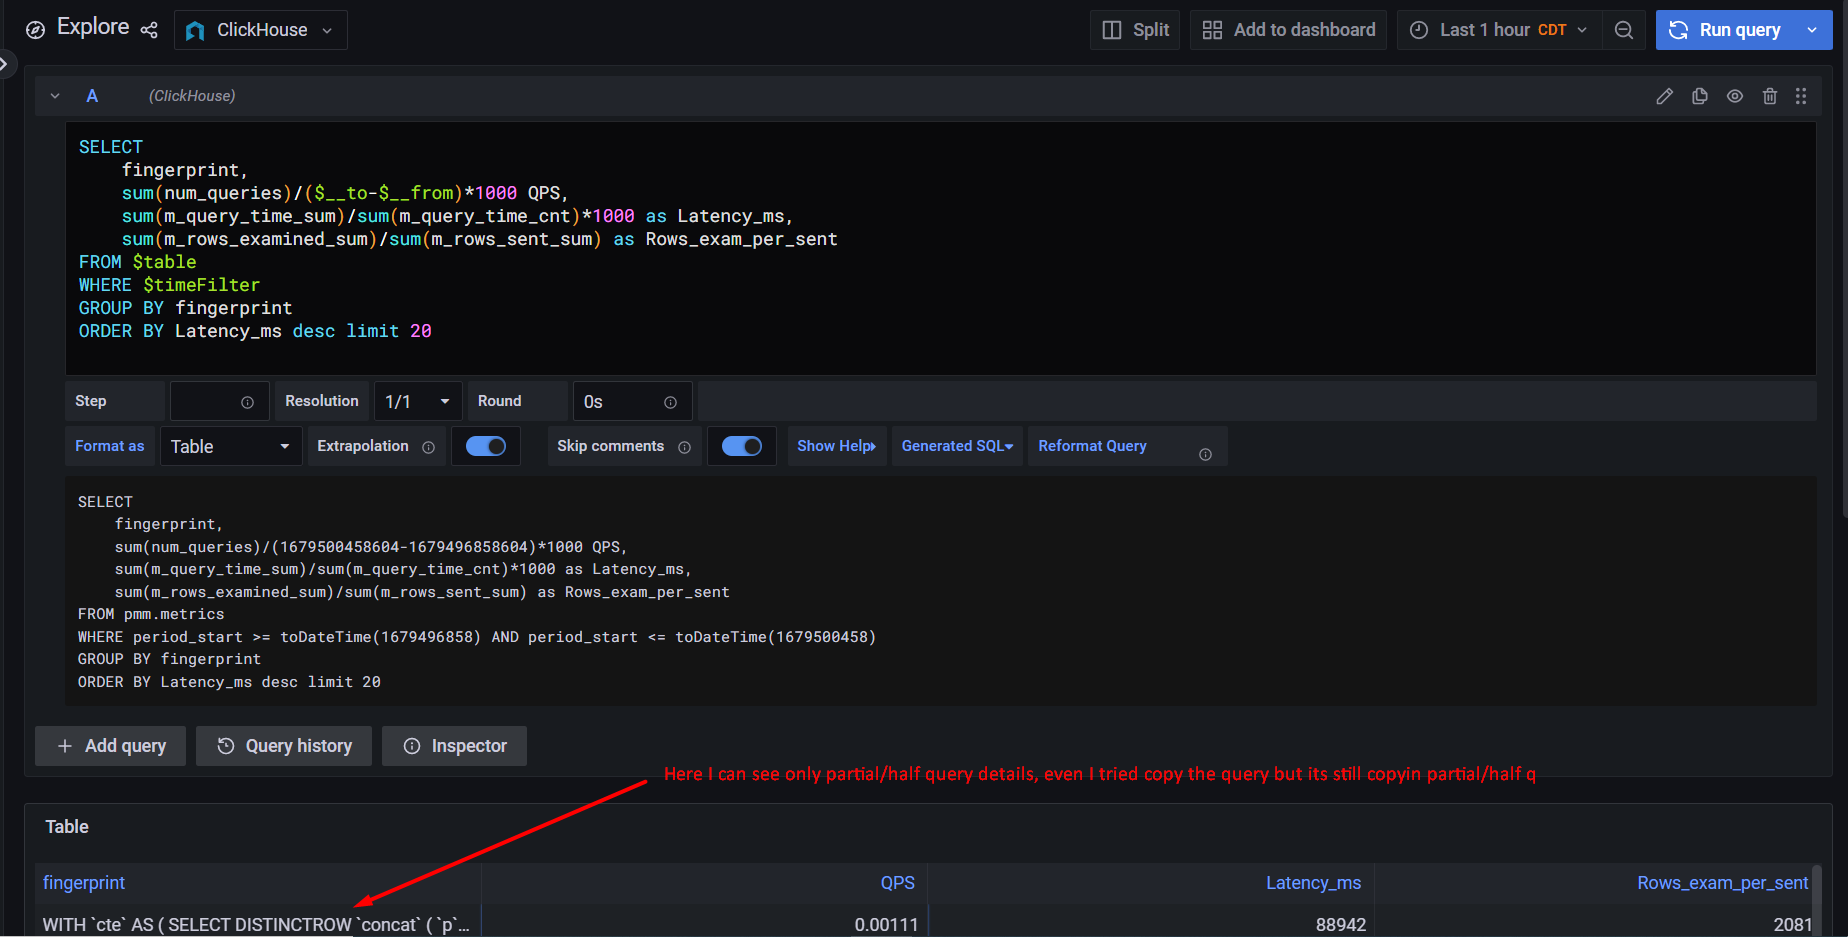
One last information, I am unable to view or copy the full query from the dashboard. Is there a way we can get full query details from the below Slowest Queries dashboard.
Example: we are seeing end of the query with dots like below.
coalesce(msi.regstn_src_cd,msi2.regstn_src_cd) as buyer_regstn_src_cd, m.crm_id as crm_id, …
I already tried the above query but still I am getting half/partial queries instead of full queries.
I am actually using mysql slowlog source as perfschema.
Here is the output for the above query. I can see only half query from the fingerprint column, even I tried to copy the query but its still copying half/partial portion of the query instead of full query.
Is there any restrictions for query length or something?
Do you see cut queries in QAN as well?
Yes @Vadim_Yalovets
I see few queries even in QAN as well.
So in such case you should create a jira ticket regarding queries in QAN.
Sure @Vadim_Yalovets
Can you please suggest me which slow log source is recommended?
There is no a preferred source.You can find the benefits and drawbacks of Slow query log and Performance Schema metrics sources in PMM documentation.
Thanks @Vadim_Yalovets for the detailed information. I thought QAN will show full query details depend up on the slow log source.
What version of PMM (server and client)?
in PMM 2.32.0 a new parameter was introduced that allowed you to tune the max query length (see max-query-length flag, previously we were truncating at 2048 chars).
you likely need to remove and re-add the node with a larger number or -1 if you want unlimited.
PMM server version is 2.35.
Client version is 2.33
If we remove node and add node then, we will loose existing data right? Without loosing existing data can’t we add this on top existing command?
I see the pmm-admin add mysql --help default value is -1 then it means by default it should be unlimited?
Hmmm…I’ll raise this to the dev team because the docs say the default is 2048 and it’s not quite clear what the --help is suggesting. I read that as “default is server-defined” which means nothing to me, then -1 would mean unlimited as a hint.
You can remove a node and re-add it with additional options and as long as the node name doesn’t change the metrics will accumulate under the old node name as you would expect. Even if you rename the node, the metrics will still be there for the “old name” until they age out according to your retention policy (30 days by default).
Unanswered | Unsolved | Solved
MySQL, InnoDB, MariaDB and MongoDB are trademarks of their respective owners.
Copyright © 2006 - 2024 Percona LLC. All rights reserved.