Package Versions
PMM Client: 3.3.0
PMM Server: 3.2.0
Subject
I have been setting up some alerting rules in Grafana, and I ran into an issue while trying to use custom labels. I ran the following command to add the PMM agent to my server with a custom label:
pmm-agent setup ... --custom-labels=env=test
I then checked the PMM UI to confirm it was added correctly:
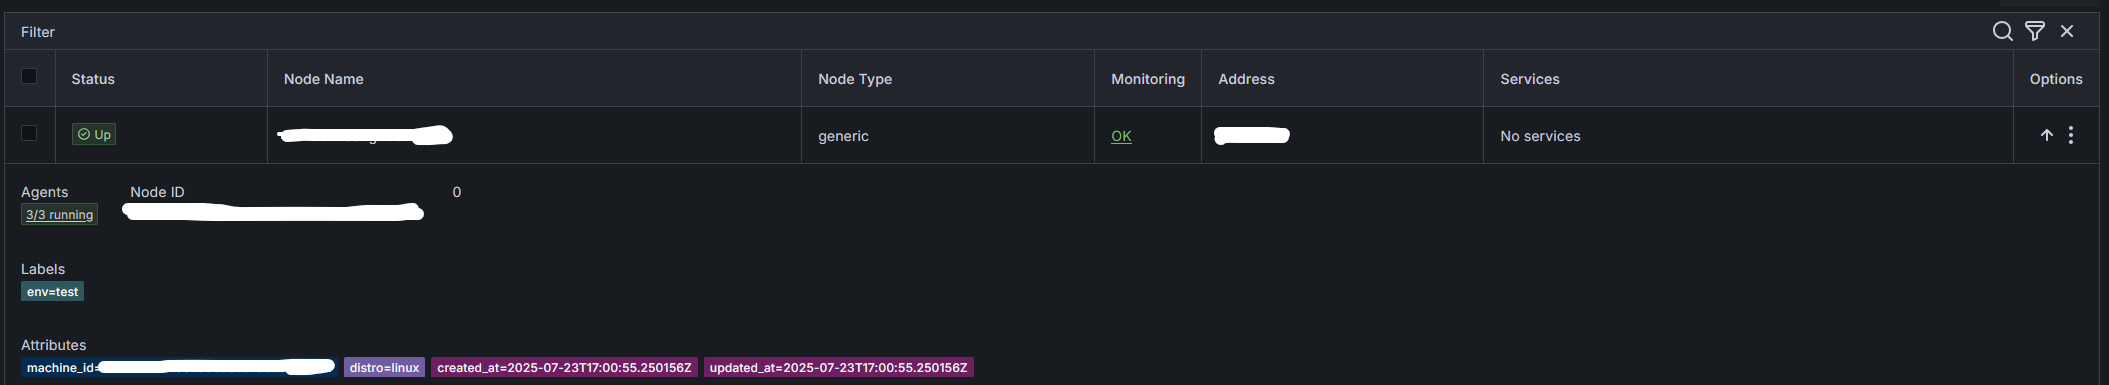
The image shows it has the label applied to the machine, but when using the pmm_managed_inventory_agents{agent_type="pmm-agent"} PromQL query there is nothing about this label:
{__name__="pmm_managed_inventory_agents", agent_id="...", agent_type="pmm-agent", disabled="0", instance="pmm-server", job="pmm-managed", node_id="...", node_name="...", version="3.3.0"}
1
On the contrary, I added my MySQL service and see the label when using the mysql_up query:
{__name__="mysql_up", agent_id="...", agent_type="mysqld_exporter", env="test", ... , service_type="mysql"}
1
I wanted to come post this and see if:
- Am I configuring something wrong, or can I be using a different query? (I pulled this query from the alerting templates)
- Is the lack of custom labels outside of the node exporter data by design?
Thank you so much for any feedback and I can provide more information if it is needed